A ZIP Code, against everything else
Four real extracts from the boundary file, drawn exactly as they ship — the same view our own analysts use.
Four real extracts from the boundary file, drawn exactly as they ship — the same view our own analysts use.
All eight formats, the documentation, and a
context/ folder with the overlay layers as GeoJSON.
The map library and the first extract are about a megabyte together, so they are not fetched until you ask for them.
Load the mapFree to explore — no signup, nothing to install.
Click a ZIP Code on the map. You will get every attribute that ships in the file, and the counties, cities, districts and tracts it actually overlaps — with the share of the ZIP each one covers.
What you are clicking is 197 of them. The licensed file carries ~32,000 polygons and ~41,000 centroids, in all eight formats, with every quarterly rebuild for the license term. You can also buy just the part you need.
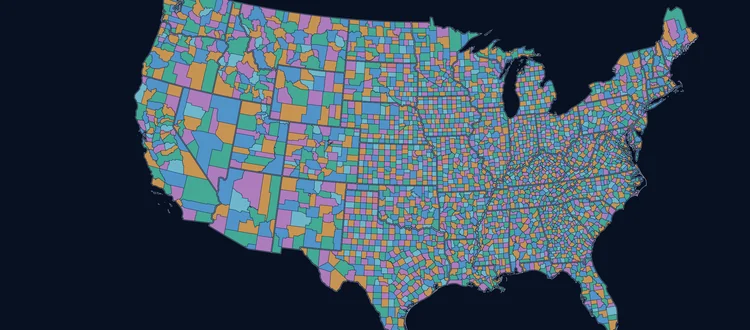
ZIP Code boundaries are drawn as black polygons; the other geographic areas are context, each in its own colour. The ZIP Code boundaries are the exact bytes from the downloadable sample archive, at full precision. The county, city, district and tract layers are Census cartographic boundaries, generalised for display so the page stays quick — they are here to show relationships, not to be measured against. The overlap percentages in the right-hand rail were computed on the full-precision geometry of both, not on what you see drawn.
Six things worth knowing before you judge the data by the picture.
The polygons come from USPS carrier route geography — the actual walk and drive sequences a letter carrier serves — rebuilt every quarter. Census ZCTAs are built the other way round: block groups aggregated to whichever ZIP appears most on their addresses, once a decade.
Switch on Census tract and the difference stops being an argument. ZIP edges cut through tracts constantly, because one follows delivery and the other follows population.
A PO Box ZIP and a Unique ZIP assigned to one building have no delivery area to draw. They are real ZIP Codes that will appear in your address data, so the file ships them as points rather than pretending they have shape.
Military ZIP Codes have no area either — and they are not in this product at all. They live in the ZIP Code Database and ZIP+4 instead, with every attribute except a shape.
In the LA Metro extract that is 196 of 498 records. Any workflow that only reads polygons drops every one of them silently — which is exactly the bug this map is designed to make visible.
Switch on Place and click almost anything. The NAME attribute is the
preferred mailing name the USPS assigns, not a municipal boundary — so a ZIP
labelled for one city routinely covers slices of three or four others, and stops well short
of the city limits.
The percentages in the rail are the honest version of that relationship: the share of the ZIP’s area inside each place, largest first.
For every ZIP with an area, the intersection of the ZIP polygon and each overlapping geography is measured, then divided by the ZIP’s own area. Same maths the internal tool runs, on the same geometry — the results were just written to a file instead of returned to a browser.
Point ZIP Codes have no area to divide by, so they report within rather than a
fabricated 100%. A percentage nobody can compute is not a percentage.
Plenty of ZIP Codes are more than one piece — an island, a parcel across a river, a
patch on the far side of a park. Those arrive as multipart geometry, and this page folds
any GeometryCollection in the sample into a MultiPolygon before
drawing, because MapLibre and Mapbox GL will not render a collection at all.
If you load our GeoJSON into a web map and a handful of ZIP Codes are missing, that is almost always why — and it is a one-line fix, not a data problem.
WGS84, SRID 4326, longitude before latitude, per RFC 7946. Nothing to reproject for PostGIS, SQL Server, ArcGIS, QGIS or any browser map.
The product ships at six decimal places — roughly 11 cm. The context layers on this page were deliberately thinned for the browser; the file you buy never is.
The percentages in the right-hand rail are not a feature of this page — they are what our ZIP Code API computes, and this map is the view we run on it. The API is built on these boundaries rather than a table of midpoints, which is why it can answer questions a lookup service cannot.
lat,lon where a ZIP Code would go and you get the ZIP whose delivery area
contains that point — plus the county, place, CBSA, Census tract and block group it
falls inside. Filler polygons are included, so a point in open country still
resolves.centroid is the usual thing: a ZIP is in or out depending on where
its midpoint lands, so a ZIP clipped by the edge of the circle is either counted whole or
missed entirely. spatial intersects the actual polygons and returns
pct_inside for every ZIP — the fraction that is genuinely in
range.One thing the API does not do: it never returns the polygon. You get coordinates, bounding boxes and overlap shares — the geometry itself only comes in the file. If you need shapes to draw, buy the boundaries; if you need answers about shapes, call the API.
The file and the API are the same data. Buy the file when you want it in your own database; call the API when you want the answer without keeping the data at all.
See the API Price the fileEvery extract on this map is a free download, in all eight formats,
with the product documentation in the archive. Each one also carries a context/
folder holding the overlay layers you have been switching on, as GeoJSON.
498 ZIP Codes · 302 polygons, 196 points
A dense metro with a high PO Box count — the hardest case, and the one that shows the polygon/point split most clearly.
8 formats · WGS84
Download sample 4.0 MB197 ZIP Codes · 138 polygons, 59 points
Nine counties across water and hills — multipart polygons, islands and holes all appear here.
8 formats · WGS84
Download sample 2.7 MB101 ZIP Codes · 82 polygons, 19 points
Spread across the whole country and every ZIP type, so you can see the range of shapes rather than one region’s.
8 formats · WGS84
Download sample 3.8 MB45 ZIP Codes · 42 polygons, 3 points
The quickest look. Small enough to open in a text editor and read the WKT by eye.
8 formats · WGS84
Download sample 1.9 MBReady for the whole country? ~32,000 polygons and ~41,000 centroids, all eight formats, every quarterly rebuild for the license term.
Price it for your project Read the data dictionary